From the frontline: CPU utilization issue on Windows Server
In early August of this year, our staging and production Octopus servers as well as our NuGet server, started to suffer from a bizarre, non-stop, repeating spikes in CPU utilization. These spikes were occurring so frequently every minute that we had service interruption/downtime as the CPU utilization was at 99% for ten to fifteen consecutive minutes at times. Since we first noticed it in mid-August, we had been investigating independently and with help from our internal Windows support staff, as well as Microsoft. While Microsoft and the Windows support staff were able to narrow down the issue to the process, we still had no idea why the issue was occurring the way it was. Here’s the CPU spikes in action on production:
 One of the Windows support staff mentioned it looked like a metronome and I couldn’t agree more. For the majority of the time, our production server was at 99% utilization for just a fraction of a second, for several times a minute. We kept seeing this repeating pattern in production, staging as well as our NuGet server. Our production server suffered a higher CPU utilization (approx. 40-50%) where as our staging and NuGet server where increasing from 25-35%. I do however, believe that was a direct result of the number of active users using production compared to staging.
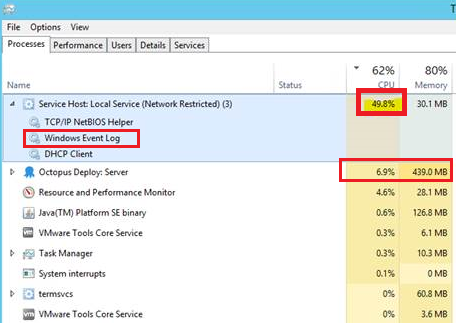 We started looking at the processes in task manager to find what exactly is consuming the CPU and we consistently saw the process “Service Host: Local Service (Network Restricted)” doing the damage. It would peak around 50% CPU utilization nearly every 3 to 4 seconds and fall back to 5-10% utilization. This cycle would be approximately 6 to 8 seconds and repeat over and over.
We first tried to scour the event logs for any specific errors/warnings. We found numerous vmstatsprovider events ids 256 and 258; anywhere from two to six events in the same second! These log events led us to this article from HP (http://h10025.www1.hp.com/ewfrf/wc/document?docname=c04179838&cc=us&dlc=en&lc=en) mentioning that VMWare Tools (both staging and production are guests on a VMWare ESX host) plus “some 3rd party monitoring tool” could be the culprit. We tried changing the VMWare Tools installation as the document instructed, but it wasn’t successful.
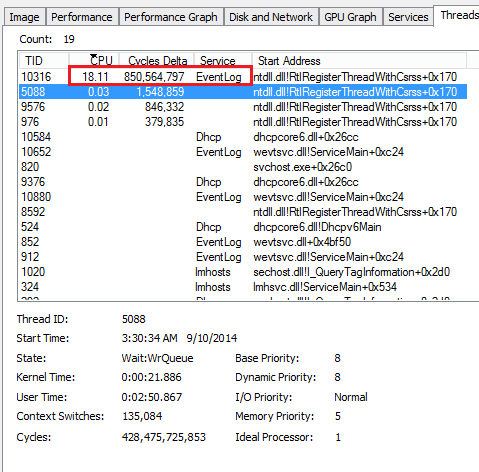 After that, we tried to narrow down which process within the service host was the offender. Using process explorer we could see that the Windows Event Log was the process behind everything. Upon further inspection of our logs, we had well over 100,000 events on staging and nearly 50,000 in production, all occurring within several weeks. The security event log showed numerous failure audits; staging showed over 317,000 events and production had over 275,000 events. Eeeek. That was my technical analysis of the situation.
Moving on, we tried a handful of other diagnostic tools and they all ended up being dead ends. After weeks of hammering away at this issue, our wonderful Windows Server support team gave us the answer to our CPU issue: Our Sumo Logic Collector service.
Apparently, when we installed the Sumo Logic Collector back in early August, we didn’t know that the Collector uses the local Windows Event Log as a source. Microsoft has deprecated an older version of the Event Log API but our Sumo Logic collector was using the newer API. It’s been documented that the newer API can cause high CPU utilization in certain virtualized environments. The Sumo Logic support team was aware of this but we were not sure what was calling the Windows Event Log service. In the end, the solution was simple: add the following line to Sumo Logic Collector/config/collector.properties and restart the Sumo Logic service.
local.win.event.collection.flag = 0
Once we added the line in the collector.properties file, all of our CPU utilization issues were resolved. Today our servers are happy and so are our users. Our production server CPU utilization now ranges from 15-30% with Octopus rightfully consuming however much CPU horsepower it needs.


It’s like going from 100 foot tidal waves to a calm sea. I’m not sure if this post is of help to anyone since Sumo Logic knows about this issue, but I wish I had known more about Sumo Logic and the Windows Event Log API issue. We installed Sumo Logic on the servers so we really caused the issue, but we had dismissed Sumo Logic since we had many other servers running it with no CPU utilization issues.


